|
|


Inflation and its Measures |
|
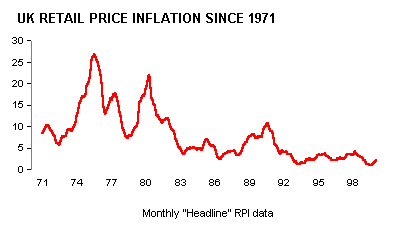
Inflation measures the annual rate of change of the general price level in the economy. Inflation is a sustained increase in the average price level.
When prices rise, the value of money falls. There is an inverse relationship between the price level and the internal purchasing power of money. When there is inflation money buys less in real terms. People can protect themselves against the effects of inflation by investing in financial assets that give a rate of return at least equal to the rate of inflation. Hyper-inflation
is extremely rare, although some countries experience it. In fact even when
the rate of inflation is rising, the prices of some goods will be falling.
The Retail Price Index (RPI) measures the average change in prices of a representative sample of over 600 goods and services. Each month, over 120,000 separate price samples are taken to compile the inflation statistics.
The index
is weighted according to the proportion of income spent by the average
household on categories of goods such as food and housing. These are
periodically changed to reflect changing consumer spending patterns in the
economy. RPI
WEIGHTS (%) The
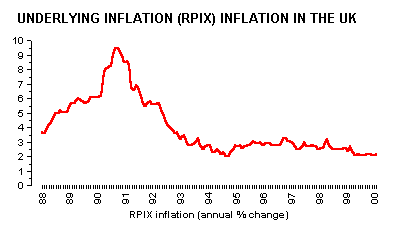
underlying rate of inflation, known as RPIX, was originally set a target of
between 1-4%. However, the Labour Government's target is for an average of
rate of growth of 2.5% over the duration of this parliament which ends in
2002. Inflation is allowed to move between 1% either side of the 2.5%
benchmark.
The calculation of the RPIX is similar to the RPI, but excludes mortgage interest payments. This is because when interest rates are increased to control aggregate demand and inflation, the immediate effect is to increase mortgage interest payments and, therefore, housing costs. As housing costs are a significant component of the RPI (see the table above), inflation is artificially increased. Thus the very policy adopted to tackle inflation actually creates a greater problem in the short run, and explains why the Government discounts this component of the RPI. RPIY, or the core rate of inflation, excludes indirect taxes and the council tax on the inflation rate. By stripping out the effect of these taxes, the Government can establish the core change of prices within the economy. Cynics would argue that it is just another way of reducing the headline rate. A new measure of inflation has recently been introduced by countries within the European Union. This is called the harmonised index of consumer prices (HICP) and is meant to provide a standardised measure of inflation for each member nation of the European Union. Input cost
inflation measures prices paid by firms for raw materials, components and
fuel. However, it does not include labour costs. . The prices at which finished goods leave the factory is measured by the Producer Price Index (PPI). The PPI is also a good leading indicator of the RPI.
Base Rate Changes |